In the sample compiled for this report, 33 of 123 older homes across Bellevue's 98004, 98008, and 98006 ZIP codes were acquired by builders and redeveloped with new construction, a combined builder-demand rate of 26.8% that places the Bellevue local submarket 42nd of 189 neighborhoods in the study (Legacy Off-Market, 2026). The older homes that changed hands sold for, on average, just 37.1% of what new construction commands on a comparable Eastside lot. That ratio should reframe every pricing conversation in these neighborhoods: when older homes trade at barely more than a third of new-build value, the market is pricing two different assets, and the seller's proceeds depend entirely on which buyer arrives with an offer.
Key Findings
- 26.8% combined builder-demand rate, ranked #42 of 189, 33 of 123 sampled homes built in 1980 or earlier across 98004, 98008, and 98006 were acquired by builders and redeveloped.
- 37.1% average price ratio, older homes changed hands at barely more than a third of new-build prices on comparable lots.
- The per-ZIP picture varies, 98004: 40 homes, 13 builder acquisitions, 32.5% rate, 38.7% price ratio; 98008: 45 homes, 11 builder acquisitions, 24.4% rate, 38.0% price ratio; 98006: 38 homes, 9 builder acquisitions, 23.7% rate, 34.5% price ratio.
- Smallest sampled lots run 6,226 to 7,000 sq ft, and downtown-adjacent and view parcels in 98004 run larger, which is what lets the builder math work on Eastside dirt.
- Demand is structural, not cyclical, tech-corridor employment, Bellevue school assignments, and a fixed infill land supply keep builder bids durable across rate cycles.
- One decision matters most, whether the seller prices the lot using the builder's own arithmetic or discounts that land value away through commissions, concessions, and months of market time.
What does the builder-acquisition record across Bellevue's three ZIP codes actually show?
It shows a steady, well-evidenced Eastside rebuild market, with the highest intensity west of downtown. Of 123 homes built in 1980 or earlier in the sample compiled for this report, 33 were acquired by builders and redeveloped, and the Bellevue local submarket ranks 42nd of 189 neighborhoods on the study's composite ranking, which weights sample size and the price-ratio signal alongside the raw rate.
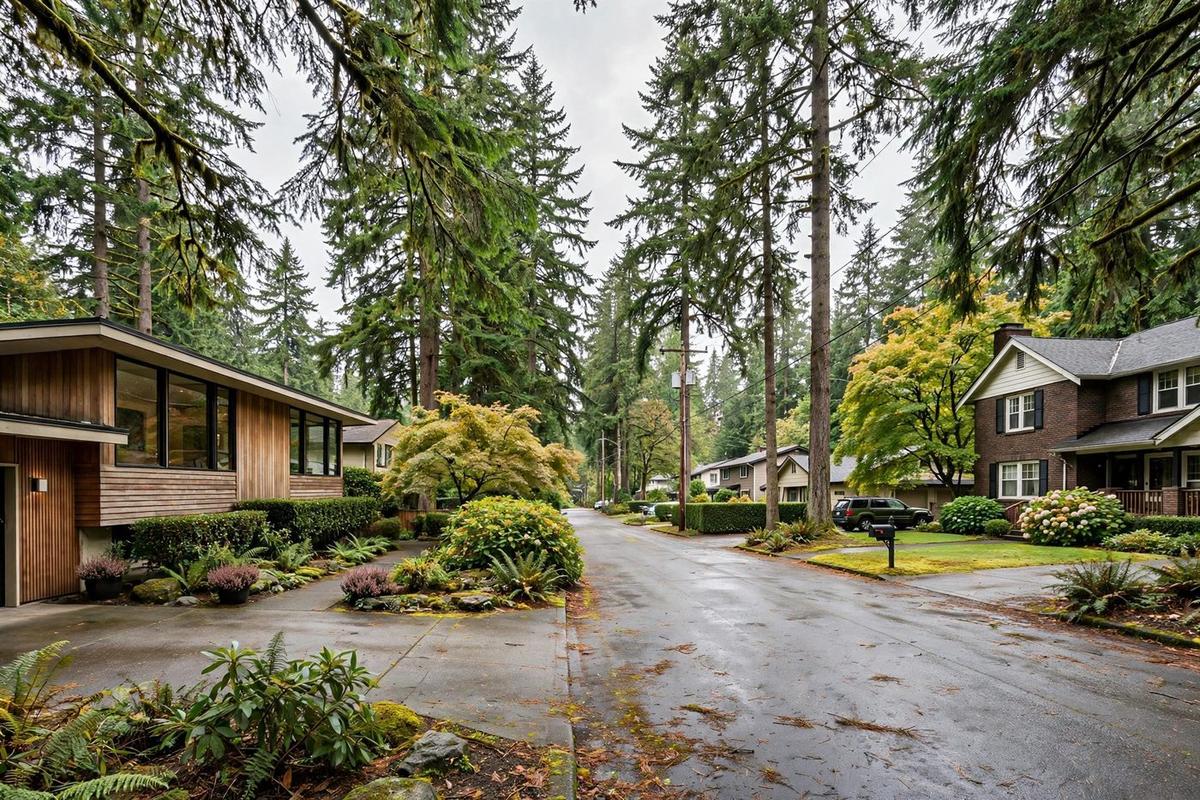
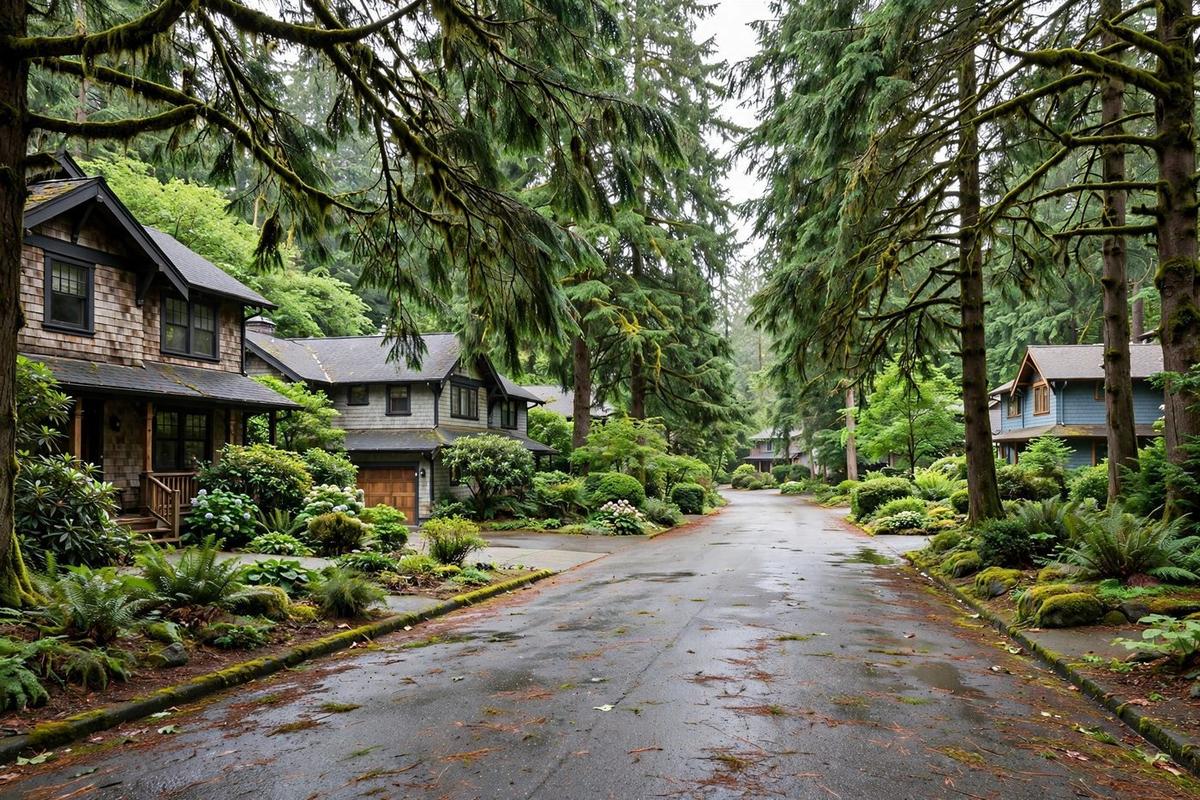
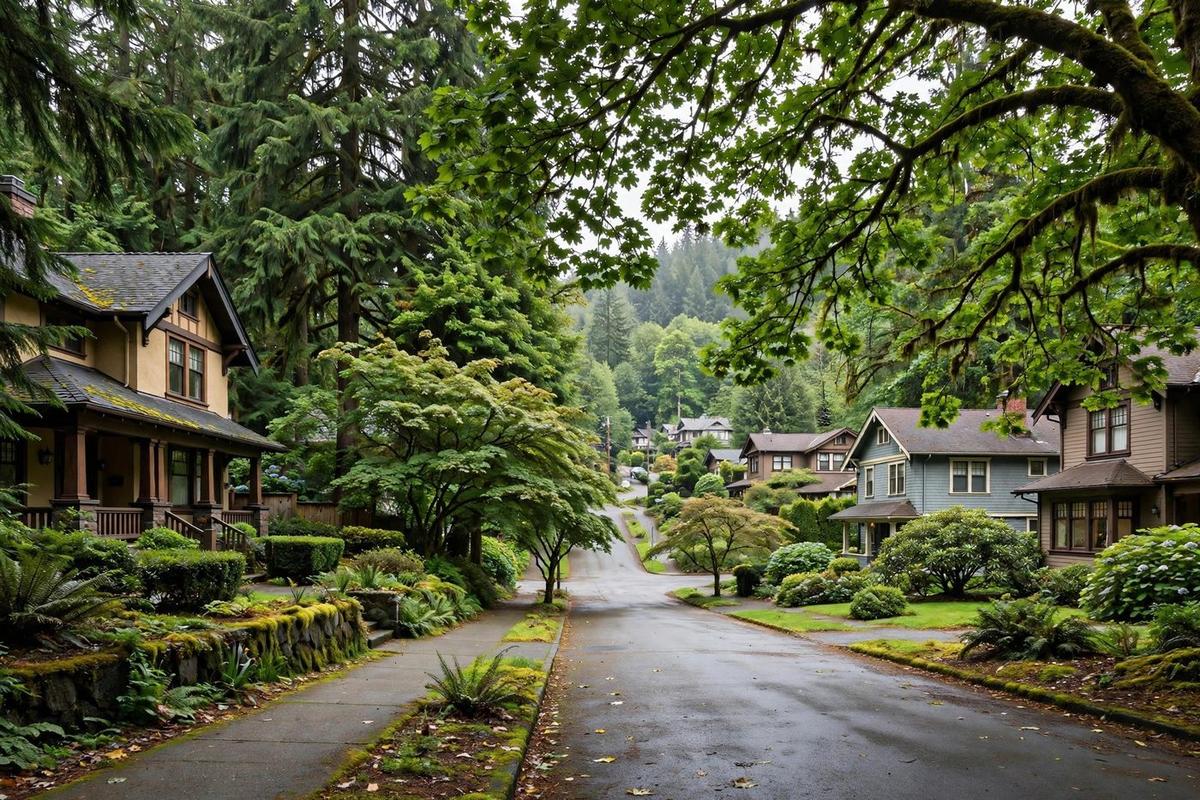
The intensity varies by ZIP, and the geography explains why. In 98004, the West Bellevue, Surrey Downs, and downtown-adjacent streets, 13 of 40 sampled homes were acquired by builders, a 32.5% rate, the highest of the three and backed by the deepest sample. In 98008, the Lake Hills, Eastgate, and Somerset-adjacent neighborhoods, 11 of 45 went the same way, 24.4%. In 98006, the southern neighborhoods of Newport Hills and the Somerset slopes, 9 of 38 were replaced, 23.7%. The pattern is consistent in kind across all three ZIPs, strongest where downtown proximity and view premiums are steepest.
For context within the study, the Lake Oswego local submarket ranked 40th with a 63.3% builder-demand rate, while Redmond, ranked 43rd just behind Bellevue, showed a 36.1% rate.
Two cautions keep this finding honest. First, the 123 homes were selected for older-home characteristics, so they over-represent exactly the homes a land buyer wants; the true neighborhood-wide builder-acquisition share is lower than 26.8%, though King County permit and assessment records confirm the direction of activity (King County Department of Assessments, 2026). Second, a builder-demand rate describes what buyers did with homes they already bought. It does not, by itself, set a seller's price. That requires the price record, which is the next section.
How wide is the gap between an older home and a new build?
Wide enough to be the whole negotiation. Across the three ZIPs, older homes changed hands at an average of 37.1% of new-construction prices on comparable lots. In concrete terms: where a new build sells for $2,700,000, the older home a few streets over changed hands for roughly $1,000,000. The $1.7 million difference is not finishes and fixtures. One buyer purchased a house, the other purchased an Eastside homesite.
The aggregate blends real differences between the ZIPs. In 98004, older homes averaged 38.7% of new-build prices; in 98008, 38.0%; in 98006, 34.5%, meaning roughly two-thirds of a new home's value in the south-side submarket sits in the land alone. Each ratio is weighted by the ZIP's house count, so the 37.1% is not an artifact of averaging averages.
Averages hide condition: the figures blend updated older homes, which sell to live-in families at real premiums, with functionally obsolete ones that sell to builders. A renovated 1960s rambler in West Bellevue can sell within striking distance of new construction on a per-square-foot basis. An unrenovated original-condition split-level on the same street sells at land value minus site-preparation cost. The spread between those two outcomes, on the same block, routinely runs into the hundreds of thousands of dollars, and it turns entirely on which buyer the seller reaches.
In this submarket, the market prices two different assets, a livable home and a development site.
What is the lot itself worth?
More than most sellers are told, and it can be estimated before any buyer calls. This is the question sellers ask most in every market in this study: how do off-market buyers actually price land? The method is public, and any seller can run a simplified version of it.
Start with the new-build sale price on a comparable lot, the "as-new" value. Recent new construction on comparable Bellevue lots has sold in the $2.5M to $4.0M range in 98004, the $2.0M to $3.2M range in 98008, and the $1.8M to $2.6M range in 98006, depending on street, views, and lot size (Redfin, 2026). Subtract the cost to build that new home, construction cost, permits, financing, and the builder's required margin, then subtract site preparation. What remains is the residual land value: the most a rational builder can pay for the dirt and still make the project work.
Worked as an illustration, not a promise: a $2,600,000 new-build sale, minus roughly $1,050,000 in hard and soft construction costs, minus a builder margin near 20%, leaves a residual land value around $1,000,000 to $1,100,000, before site-preparation costs of $30,000 to $50,000. That residual is the number a land buyer negotiates against, and it sits well above what many older homes list for when marketed as houses rather than homesites.
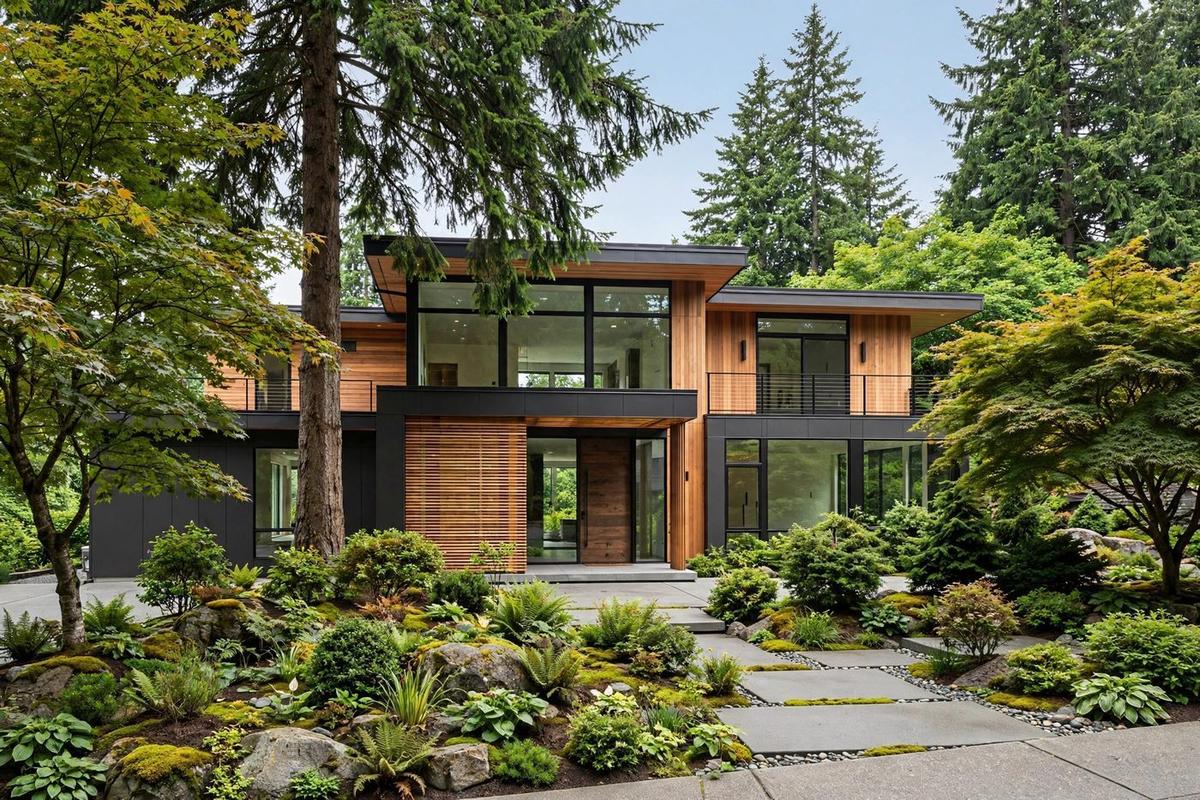
Four things move that number on the Eastside. Lot size is first: with sampled lots as small as 6,226 square feet in 98004 and 7,000 in 98008, every additional foot of width matters to a builder's floor plan. Second is zoning flexibility: Bellevue's ADU allowances and, on qualifying parcels, lot-split potential can add a second unit to the builder's underwriting. Third is position within the submarket: downtown-adjacent streets, view corridors, and school assignments show up in new-build comps but are often underpriced in older-home listings. Fourth is structural demand: the tech-corridor job base and a fixed infill land supply keep the builder bid durable across interest-rate cycles.
Should you fix it up or sell as-is?
In an off-market builder market, renovation is usually the most expensive way to learn what the land is worth. "Sell my house as-is or fix it up?" is the most-asked question type in the seller research behind this series, and the 37.1% price ratio across Bellevue sharpens the answer: the market is already telling you the structure is a fraction of the finished product.
Consider what a renovation buys. A $150,000 kitchen-and-bath update on a 1970s split-level might lift the sale price by $100,000 to $130,000 if the buyer intends to live in the home, a partial return, before the months of disruption. If the buyer intends to replace the house, the same $150,000 buys exactly $0: the finishes are stripped with the walls. With more than one in four sampled older homes torn down, the probability-weighted return on pre-sale renovation is poor, because a large share of the buyer pool assigns the improvements no value at all.
There is an exception, and honesty requires naming it. If the home is genuinely livable and well-kept, updated systems, no functional obsolescence, listing it as a home rather than a homesite can capture the "live-in" buyer premium, which on the Eastside is substantial. The distinction is condition, not sentiment. A seller should get a candid assessment of which of the two assets they own, a house someone will live in, or a lot someone will build on, before spending a dollar on the structure. Spending on the wrong one is how sellers leave six figures on the table.
An off-market sale is, by definition, an as-is sale. No repairs, no staging, no pre-listing punch list. For a home that is a candidate for builder acquisition, that is not a concession. It is the correct format: the buyer never wanted the finishes anyway.
What does listing on the open market really cost?
More than the commission rate suggests, once time is priced in. Sellers underestimate the all-in cost of a traditional listing, because the visible costs are only part of the ledger.
First, the commission: typically 5% to 6% of the sale price in the Seattle-Eastside market, split between listing and buyer's agents. On a $1,200,000 sale, that is $60,000 to $72,000 off the top (National Association of Realtors, 2025). Second, seller-side closing costs, title, Washington's real estate excise tax, prorations, commonly another 1% to 2%. Third, concessions: buyers inspecting 50-year-old homes routinely negotiate repair credits and reductions of $12,000 to $40,000 on older inventory.
Fourth, and most underweighted, is carrying cost over market time. Every month a listing sits, the seller pays the mortgage or opportunity cost of equity, insurance, taxes, utilities, and maintenance. At Eastside price levels, three to six months of market time, normal for older homes that do not fit the new-build buyer pool, costs $25,000 to $90,000 in pure hold expense. Fifth is the showing cost, which is not financial but real: months of keeping a home show-ready and living in limbo.
Add the midpoints and a $1,200,000 list price nets the seller in the low-to-mid $1,000,000s after a normal market cycle, before any price reduction. This is the number an off-market offer should be compared against: not the list price, but the net proceeds after the full cost of achieving it.
How fast can an off-market sale close, and how do you screen the buyer?
A direct cash buyer can close in 7 to 21 days, but speed is worthless without verifying the buyer. The mechanics of a fast close are straightforward. The buyer verifies funds and pulls public records. A title company runs the title search and clears any liens, the step that most often sets the actual pace, typically 7 to 14 days. The purchase agreement is signed with no financing contingency and no assignment clause. The buyer's earnest money goes hard. Then the closing funds and records. No showings, no staging, no open houses, no buyer-mortgage underwriting, no inspection-renegotiation cycle. The off-market cash offer rarely matches the top of a successful listing's range; it competes against the listing's net proceeds after the ledger in the previous section, not against its asking price.
Now the screen. The off-market space contains legitimate direct buyers and wholesalers who never intend to buy your home at all. A wholesaler signs a purchase contract with no means or intent to close, then shops the contract to a real buyer for a fee, profiting from the spread between the offer to you and the end buyer's price. The model requires buying your home for less than a direct buyer would pay, because the fee comes out of your equity.
Three verifications separate the two. First, proof of funds in the buyer's name, dated within the last 30 days, not a "pre-approval," not a private-lender letter. Second, a record of actually closed purchases: recorded deeds in the buyer's entity name, checkable in county records (King County Recorder, 2026). Third, the contract: a direct buyer closes in the name on the contract, with no assignment clause, and puts up a meaningful earnest-money deposit, typically 1% or more, forfeited if it walks away. An assignment clause plus a token deposit is the signature of a contract never meant to close. Ask the three questions especially when speed is the pitch. The real buyers will welcome them.
What do sellers gain by staying off-market?
Privacy, timing control, and a transaction built around the seller's calendar instead of the market's. Beyond the numbers, the format of an off-market sale carries five practical advantages.
First is privacy. No showings, no open houses, no strangers walking through the home. The sale never appears as an active listing, so neighbors are not tracking the price history.
Second is control of the timeline: a direct sale typically closes in 7 to 21 days, versus 60 to 120-plus days for a listed older home. The seller sets the closing date rather than the market dictating it. A seller who needs months to find the next home can set a distant closing, and leaseback arrangements, where the seller stays past the closing date, are common and give the move its own schedule.
Third, there is no commission. With no listing agent and no buyer's agent, the 5% to 6% a traditional sale gives away stays with the seller (National Association of Realtors, 2025). Fourth, the seller pays no closing costs: none of the typical 1% to 2%, and commissions plus closing costs commonly exceed $40,000 on a $650,000 transaction. Fifth, there are no inspections or repairs: no punch lists, no $10,000 to $30,000 credit negotiations after an inspector finds a 1974 electrical panel, no contractors in the driveway before closing.
Together, these five points explain why the off-market path is not merely a price decision. It is a quieter, faster transaction, scheduled around the seller's life.
Methodology and limitations
This report draws on four source types. First, Legacy Off-Market's builder-demand sample for the 189-neighborhood study: 123 homes across the Bellevue local submarket's three ZIPs (98004, 98008, 98006), all built in 1980 or earlier, of which 33 were acquired by builders and redeveloped, with a houses-weighted average older-home sale price of 37.1% of new-build prices on comparable lots (Legacy Off-Market, 2026). Second, public records: King County Department of Assessments parcel and permit data, used to confirm rebuild activity directionally. Third, market data: dated sold listings from Redfin's sold-listing record for 98004 and Zillow across the three ZIPs, used for the new-build price ranges cited. Fourth, seller-question research: 348 distinct real questions, used to select this report's questions, not quoted as data.
What was not done: no title search on any individual property, no inspection of any home's condition, no zoning determination for any specific parcel, and no verification of any specific new-build sale beyond its listing record. The new-build price ranges are illustrations from dated listings, not appraisals.
The central limitation is the sample. One hundred twenty-three homes, selected for older-home characteristics, cannot describe every parcel across three ZIP codes. The 26.8% figure describes the sample, and the sample was built to find builder acquisitions. Treat it as evidence of a genuine, well-documented off-market builder market, which the permit record corroborates, not as a census of the neighborhood.
Conclusion
So what is a 1970s Bellevue lot really worth? The answer: whatever a builder can pay for the dirt after subtracting construction cost, margin, and site preparation from the new-build sale price, a number that lands well above what most older homes list for as houses. With 33 of 123 sampled older homes bought for their land, and older homes changing hands at 37.1% of new-build prices, the probability is meaningful that your buyer is a land buyer, and land buyers do not need your home staged, photographed, and shown for four months. They need the lot, a clear title, and a seller who knows the residual math.
The portrait across the record is consistent. The price gap between old and new is the seller's leverage, if the seller prices the land rather than the structure. The cost of a traditional listing, commission, excise tax, concessions, carrying costs, months of limbo, is the number every off-market offer should be measured against.
Legacy Off-Market buys directly across the Bellevue local submarket as a principal, not an intermediary, with proof of funds and recorded closings behind every offer. Sellers can reach the acquisitions team at 401-219-4207 or aidansowa@outlook.com.
When a third of the older homes around you were bought for the dirt beneath them, what exactly would a listing be selling?
Frequently Asked Questions
How do I know if Legacy Off-Market buys in my ZIP code?
The company currently buys across 189 ranked neighborhoods, with the Bellevue local submarket (ZIPs 98004, 98008, 98006) ranked 42nd. Use the ZIP lookup tool on the coverage page to confirm, or call 401-219-4207.
Will I get less selling off-market than listing with an agent?
Compare net proceeds, not prices. A $1,200,000 list price typically nets in the low-to-mid $1,000,000s after commission, Washington excise tax, seller closing costs, concessions, and months of carrying costs. An off-market offer has none of those deductions. Get the off-market number first, then decide.
Do I need to make repairs before selling off-market?
No. Off-market sales are as-is by definition. In an off-market builder market like Bellevue's, pre-sale renovation is usually a poor investment, because a large share of the buyer pool assigns the improvements no value.
How fast can an off-market sale really close?
Typically 7 to 21 days for a direct cash buyer with clean title; the seller sets the date, and title clearance is usually the pace-setting step.
How is an off-market buyer different from a wholesaler?
A direct buyer closes in its own name with its own funds and forfeits a real deposit if it walks away. A wholesaler assigns your contract to someone else for a fee. Ask for proof of funds, recorded prior closings, and a non-assignable contract.
What does Legacy Off-Market need from me to make an offer?
The property address, your timeline, and permission to pull public records. Call 401-219-4207 or email aidansowa@outlook.com.
Sources
- King County Department of Assessments, 2026. Parcel and permit records, Bellevue WA. Official record.
- Legacy Off-Market, 2026. 189-neighborhood builder-demand study: 123 homes sampled across Bellevue local submarket (98004, 98008, 98006), 33 acquired by builders and redeveloped, average older-home price 37.1% of new build. Proprietary sample; methodology in the limitations section above. Industry report.
- National Association of Realtors, 2025. Typical seller commission structures, Seattle-Eastside market. Industry report.
- Redfin, 2026. Recently sold homes and new construction, ZIP codes 98004, 98008, 98006, Bellevue WA. Market data.
- U.S. Census Bureau, 2025. QuickFacts: Bellevue city, Washington. Government data.
- Zillow, 2026. Home values and recently sold, Bellevue WA. Market data.