In the sample compiled for this report, 18 of 37 older homes in Mount Pleasant's 29464 were acquired by builders and replaced with new construction, a builder-demand rate of 48.6%, ranking the neighborhood 25th of 189 neighborhoods in the builder-demand study (Legacy Off-Market, 2026). The older homes that changed hands sold for, on average, 35.8% of what new construction commands on a comparable lot in the same neighborhoods. Nearly half of sampled older homes were bought for the land beneath them, and the ones that sold went for about a third of new-build prices. In a market shaped like that, the fix-it-up question is not a design question. It is a probability question: what are the odds the buyer values your renovation at all? This report runs the numbers.
Key Findings
- 48.6% builder-demand rate, ranked 25th of 189 neighborhoods: 18 of 37 sampled homes built in 1980 or earlier in 29464 were bought by builders and replaced, placing the neighborhood 25th on the study's composite ranking.
- 35.8% price ratio: older homes sold for just over a third of new-build prices on comparable lots, meaning nearly two-thirds of a new home's value sits in the land.
- 6,969 sq ft minimum lot: the smallest parcel in the sample; marsh-front and creek lots run larger, and water access is priced as its own asset.
- The renovation trap is mathematical: with nearly half of sampled homes bought by builders, the expected return on pre-sale renovation is negative for most properties.
- East Cooper land scarcity: bounded by water on three sides, Mount Pleasant's finite close-in inventory supports the residual land values builders pay.
What does the builder-acquisition record in 29464 actually show?
It shows a near-majority builder market east of the Cooper River. Of 37 homes in the 29464 sample built in 1980 or earlier, 18 were acquired by builders, 48.6%, and the neighborhood ranks 25th of 189 on the study's composite ranking. The composite ranking weights sample size alongside the raw rate, so a 48.6% rate on 37 homes lands just inside the top 25: strong evidence, mid-sized sample.
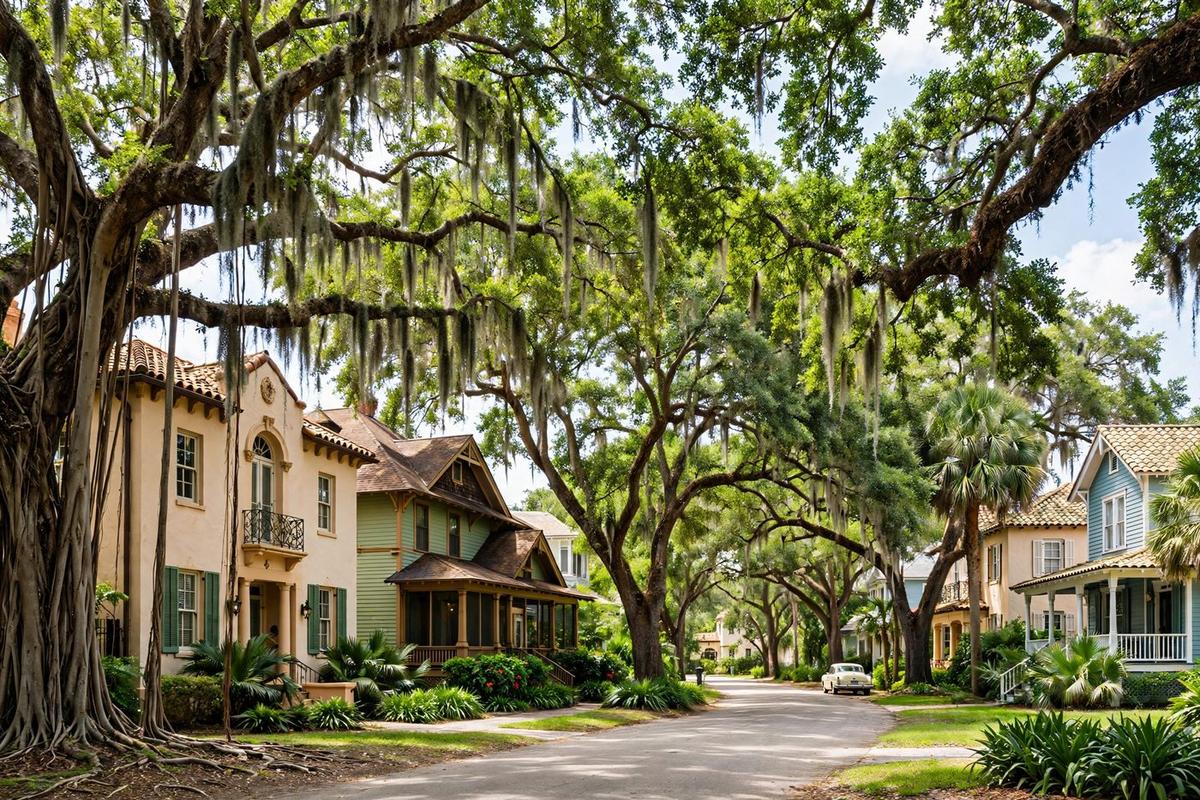
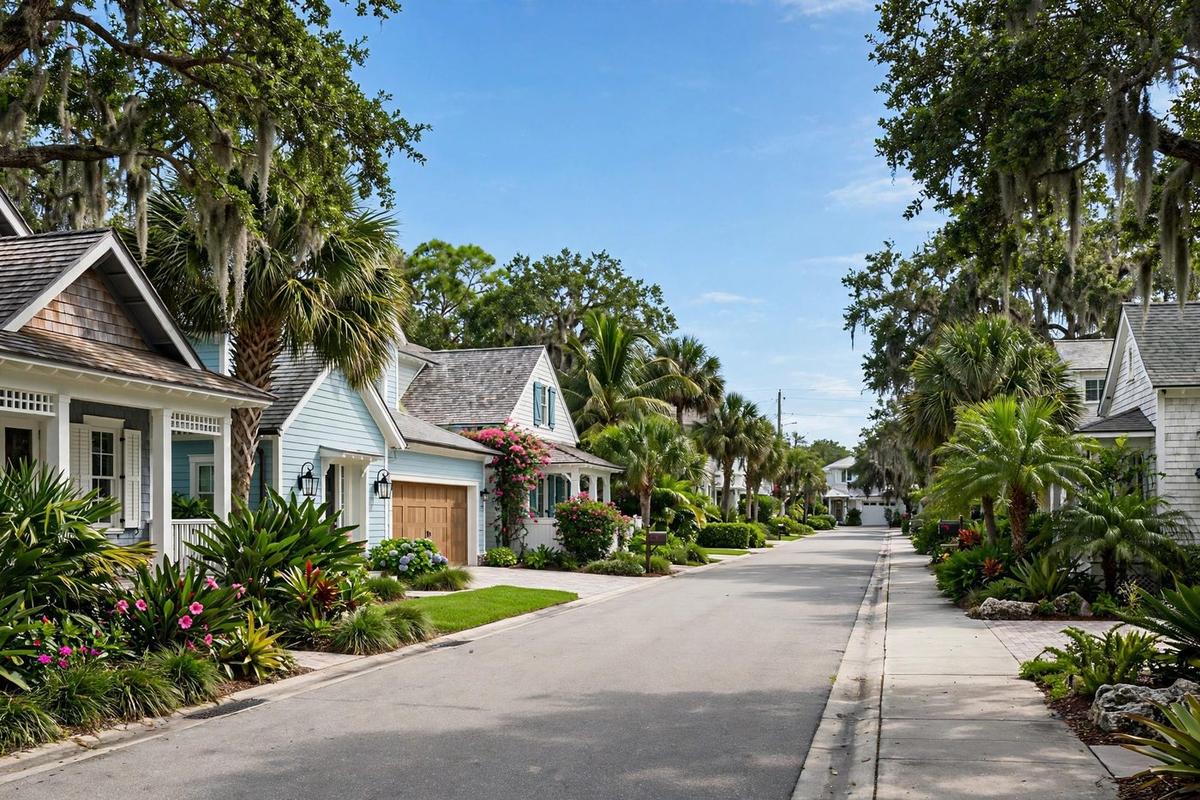
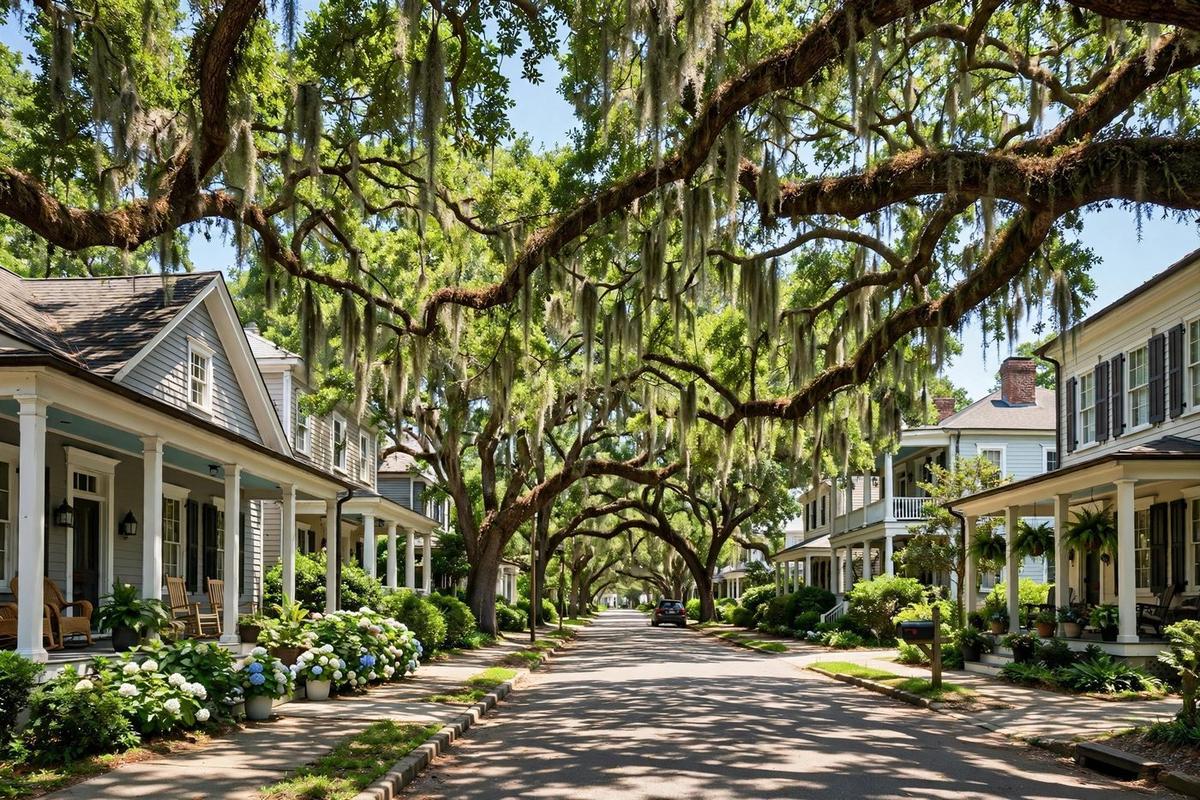
What the record describes is the Mount Pleasant pattern: mid-century ranch homes and Lowcountry cottages, in the Old Village, the neighborhoods off Coleman Boulevard, and along the marsh creeks, bought by builders and custom-home buyers, acquired and replaced with elevated new construction built to current flood standards. Charleston County permit records confirm the direction of the trend, with infill rebuild activity a durable feature of the East Cooper market (Charleston County Assessor, 2026).
The pattern is familiar across the study. In Southside Village, ranked 24th of 189 neighborhoods with a builder-demand rate of 67.9%, builders run the same close-in acquisition playbook on compact lots near the water.
Two cautions keep this finding honest. First, the sample is 37 homes selected for builder-target characteristics, not the whole ZIP code; the true ZIP-wide builder-acquisition share is lower than 48.6%. Second, a builder-demand rate describes what buyers did with homes they already bought. It does not, by itself, tell a seller what their home will fetch: 19 of the 37 sampled homes were not acquired by builders. The price record, taken up next, is what separates the two outcomes.
How wide is the gap between an older home and a new build?
Wide, and widened further by what it costs to keep an older Lowcountry home standing. In the 29464 sample, older homes sold for an average of 35.8% of the price of new construction on comparable lots. Put in concrete terms: where a new build sells for $1,700,000, the older home nearby changed hands for roughly $609,000. The $1.09 million difference is not explained by finishes and fixtures. It is explained by the fact that one buyer purchased a house and the other purchased a homesite east of the Cooper.
This ratio deserves a careful reading, because averages hide condition, and in the Lowcountry, they hide elevation. The 35.8% figure blends updated older homes, which sell to families who will live in them, with functionally obsolete ones that sell to builders. But there is a local force pressing on the old-house side of the ratio: flood risk and the cost of mitigating it. An older home at grade in a flood zone carries insurance and flood-mitigation costs a new elevated build does not, and buyers price that carrying cost into what they will pay for the old house.
A comparable water-driven gap appears in East Delray, ranked 26th of 189 neighborhoods with a builder-demand rate of 64.3%, where coastal insurance plays the same role that flood elevation plays here. The finding for 29464: the market does not price "a house." It prices two different assets, a livable home and a development site, and the seller's proceeds depend on which asset the buyer believes they are acquiring.
What is the lot itself worth?
East of the Cooper, the lot is priced on water, elevation, and finite supply. The residual land method still applies: start with the new-build sale price on a comparable lot, subtract construction cost, margin, and site preparation. Recent new construction in 29464 has sold in the $1.3M to $2.5M range depending on neighborhood, water access, and elevation (Redfin, 2026).
Worked as an illustration, not a promise: a $1,700,000 new-build sale, minus roughly $700,000 in hard and soft construction costs, minus a builder margin near 20%, leaves a residual land value in the neighborhood of $640,000 to $740,000, before site-preparation costs of $20,000 to $35,000.
Three things move that number in 29464. First is water: marsh-front and creek lots carry premiums that show up in the new-build comps but rarely in the older-home listings, and deepwater access is a separate asset class entirely. Second is elevation and flood zone: a lot that builds above base flood elevation without heroic foundation work is worth more than one that doesn't, because the builder's cost, and the finished home's insurance, both depend on it. Third is scarcity: Mount Pleasant is bounded by water on three sides, and close-in lots cannot be manufactured. At the sample's 6,969 sq ft minimum, and many parcels running larger, the buildable envelope and what it sits above are what the builder is really buying.
Should you fix it up or sell as-is?
In a 48.6% builder-acquisition market, the expected return on renovation is negative for most properties, and that is arithmetic, not opinion. This is the most-asked question type in the seller research behind this series, it is this report's headline question, and in 29464 the data answers it about as sharply as data can.
Consider what a renovation buys. A $110,000 kitchen-and-bath update on a 1965 ranch might lift the sale price by $70,000 to $95,000 if the buyer intends to live in the home, a partial return, before the months of disruption. If the buyer intends to redevelop, the same $110,000 buys exactly $0. Weight those outcomes by the sample's 48.6% builder-acquisition rate and the expected value of the renovation is roughly half its cost, before accounting for the months of carrying costs during the work. That is the renovation trap: spending a dollar to create, on average, fifty cents of value.
There is an exception, and honesty requires naming it. If the home is genuinely livable and well-kept, updated systems, no functional obsolescence, elevation that doesn't frighten insurers, listing it as a home rather than a homesite can capture the live-in buyer premium, which in Mount Pleasant is real and well-funded. The distinction is condition, not sentiment. A candid assessment of which of the two assets the seller owns, a house someone will live in, or a lot someone will build on, should precede any spending on the structure.
What does listing on the open market really cost?
More than the commission rate suggests, once time is priced in. The full ledger: typically 5% to 6% of the sale price in the Charleston-area market, so on an $850,000 sale, $42,500 to $51,000 off the top (National Association of Realtors, 2025). Seller-side closing costs, title, transfer fees, prorations, add another 1% to 2%. Concessions: buyers inspecting 60-year-old Lowcountry homes negotiate repair credits and price reductions after inspection, often $10,000 to $30,000, with flood-zone and elevation documentation giving them leverage.
Then carrying cost over market time: every month a listing sits, the seller pays mortgage or equity opportunity cost, insurance, taxes, utilities, and maintenance. In the Lowcountry, the insurance line on an older home, wind, hail, and flood where applicable, can run several hundred dollars a month, and three to six months of market time, normal for older homes, costs $18,000 to $40,000 in pure hold expense.
Add the midpoints and an $850,000 list price nets the seller something in the low $700,000s after a normal market cycle, before any price reduction. This is the number an off-market offer should be compared against: not the list price, but the net proceeds after the full cost of achieving it.
What would it be worth to sell without ever listing?
Five measurable advantages, each carrying a number. The off-market path changes the economics of the sale in five specific ways.
First is privacy. Zero showings, zero open houses, no lockbox, no public marketing period, no neighbors tracking the photographer's visits and speculating about the asking price. The sale happens between the seller and one buyer, with nothing on public display. The neighbors find out when the deed records, not before.
Second is control over timing. A listing compresses the seller into the market's schedule; an off-market buyer negotiates the closing date around the seller's life. A direct sale can close in 7 to 21 days, compared with 60 to 120-plus days for a listed older home once market time is counted, or it can go the other way: time to find the next home, to coordinate a move, to settle an estate, even to stay past closing under a short leaseback while the new home is ready.
Third, there is no commission. None of the typical 5% to 6% (National Association of Realtors, 2025): on an $850,000 sale, $42,500 to $51,000 stays with the seller. Fourth, there are no closing costs on the seller's side: none of the typical 1% to 2% in title, transfer, and recording charges. Commissions plus closing costs commonly consume 6% to 8% of the sale price, on an $850,000 Mount Pleasant transaction roughly $50,000 to $68,000, kept by the seller. Fifth, there are no inspections or repairs. The sale is truly as-is: no $10,000-to-$30,000 repair credits after the buyer's inspection, no renegotiation, no appraisal from the buyer's lender resetting the price.
Priced together, those five advantages are why an off-market number should never be compared to a list price. It should be compared to the list price minus everything the listing would have cost, including the insurance carrying costs that inflate every month of market time in the Lowcountry.
How do you tell a closer from a contract-flipper?
Three checks, each verifiable, and they take less than an hour. Start with honest disclosure: Legacy Off-Market is a wholesaler, and the meaningful question is not whether a wholesaler is involved but how that wholesaler works. The company signs a purchase contract directly with the seller, buys the property itself with its own capital, and then places the deal with a vetted builder. One seller, one funded buyer, one closing.
The problem operator works differently. A contract-flipper signs your agreement, then assigns the contract itself to a real buyer, pocketing the spread from your equity. That spread is why the flipper must buy for less than a real closer would pay.
First check: proof of funds in the buyer's own name, dated within 30 days, covering the full purchase price, not a pre-approval or a letter from a private lender. Second: a record of closed deals, recorded deeds in the buyer's entity name, checkable through the Charleston County Register of Deeds (Charleston County Register of Deeds, 2026). Third: the contract itself, one the buyer intends to close, backed by a meaningful earnest deposit and transparency about placing the property with its builder network afterward. A contract paired with a token deposit and silence when you ask for proof of funds is the tell of an agreement never meant to close.
Does flood risk change what your Mount Pleasant home is worth?
Yes, it reprices the old house down and the new build up, widening every gap in this report. Water is the defining fact of Mount Pleasant real estate: the marsh creeks, the Cooper River, the flood zones that overlay much of the close-in housing stock. It deserves its own section because it moves numbers that look, at first glance, like pure structure discounts.
The mechanism is straightforward. An older home at or near grade in a flood zone carries flood insurance costs, and elevation-related lending constraints, that a new elevated build does not. A live-in buyer prices that annual cost into their offer: every thousand dollars of yearly premium is capitalized into a lower purchase price. That is part of why the 35.8% price ratio sits where it does: the old house is discounted not only for its age but for what it costs to keep dry, or at least insured.
The builder's side of the trade sees the same fact in reverse. New construction in 29464 is built elevated to current flood standards, which resets the insurance equation and removes the elevation objection for the next buyer. Part of the residual land value computed earlier is, economically, the value of escaping the old home's flood exposure. What the flood math does not do is change the classification question. It makes the old-house outcome worse and the land outcome relatively better, which sharpens the decision rather than altering it.
Methodology and limitations
This report rests on three evidence types. The core is the builder-demand sample compiled for the 189-neighborhood study: 37 homes in 29464 built in 1980 or earlier, 18 acquired by builders and replaced, with older homes selling at an average of 35.8% of new-build prices on comparable lots (Legacy Off-Market, 2026). Supporting it are public records, chiefly Charleston County Assessor parcel and permit data, used to confirm that infill rebuild activity runs in the direction the sample suggests, and dated sold listings from Redfin and Zillow behind the new-build price ranges in the residual math (Charleston County Assessor, 2026; Redfin, 2026). The questions answered here were drawn from 348 distinct real seller questions, used as a menu of question types, not quoted as data.
Not verified: no title search on any property, no inspection of any home's condition, and no specific new-build sale beyond its listing record, so the illustrated price ranges are starting points, not appraisals. The residual land arithmetic is a simplified model; real builder underwriting adds financing structure, entitlement risk, and carry assumptions this report does not attempt.
The central limitation is the sample. Thirty-seven homes, selected for builder-target characteristics, cannot describe every parcel in 29464, a ZIP that spans the Old Village, marsh-front streets, and inland subdivisions, different markets with different flood exposures. The 48.6% figure describes the sample, and the sample was built to find builder acquisitions. Treat it as evidence of an active East Cooper builder market, corroborated by the permit record, not as a census of the ZIP code.
Conclusion
So should you fix it up or sell as-is in Mount Pleasant? On the record assembled here, the answer is usually as-is, and the reason is arithmetic. With 48.6% of sampled older homes acquired by builders, the expected value of a renovation is roughly half its cost, because the modal buyer assigns the improvements no value at all. The exception is the genuinely livable home that a family buyer will pay a premium for, but that classification has to be made with evidence, before the first dollar is spent, not with hope after the last one.
The same arithmetic discipline applies one rank away in Washington Park and Bonnie Brae, ranked 27th of 189 neighborhoods with a builder-demand rate of 75.0%, where the builder-acquisition share runs higher still. The cost of a traditional listing, commission, concessions, carrying costs inflated by Lowcountry insurance, months of limbo, is the number every off-market offer should be measured against.
Legacy Off-Market buys directly from sellers in 29464 and the other 188 neighborhoods in this study, then places each deal with a vetted builder, with proof of funds and recorded closings behind every offer. Sellers who want the off-market number can reach the acquisitions team at 401-219-4207 or aidansowa@outlook.com, with an address and a rough timeline.
When nearly half the older homes in your neighborhood were bought for the land beneath them, is your renovation budget an investment, or a donation to the builder's site-preparation crew?
Frequently Asked Questions
How do I know if Legacy Off-Market buys in my ZIP code?
The company buys in 189 neighborhoods across 37 states, ranked by builder activity, with Mount Pleasant's 29464 ranked 25th. Check your ZIP on the coverage page, or call 401-219-4207.
Will I get less selling off-market than listing with an agent?
Only the net comparison can answer that. An $850,000 list price typically lands in the low $700,000s after commission, seller-side closing costs, concessions, and months of carrying costs, with Lowcountry insurance inflating the hold expense. An off-market offer carries none of those deductions. Get the off-market number first, then the comparison is real.
Do I need to make repairs before selling off-market?
No. Off-market sales are as-is by definition. In a 48.6% builder-acquisition market like 29464, pre-sale renovation usually returns about half its cost in expected value, because the modal buyer assigns the improvements no value.
How fast can an off-market sale close?
A funded cash buyer typically closes in 7 to 21 days, compared with 60 to 120-plus days for a listed older home once market time is counted. The seller sets the closing date, and a short leaseback past closing is often negotiable.
How is Legacy Off-Market different from a wholesaler who only assigns contracts?
Legacy Off-Market is a wholesaler that actually closes: the company buys the property itself with its own funds, then places the deal with a vetted builder. A contract-flipper signs with no intent to close and assigns the contract to a real buyer for a fee. Ask for proof of funds, recorded prior closings, and a contract the buyer intends to close itself.
What does Legacy Off-Market need from me to make an offer?
The property address, your timeline, and permission to pull public records. No showings to strangers, no staging, no open houses. Call 401-219-4207 or email aidansowa@outlook.com.
Sources
- Charleston County Assessor, 2026. Parcel and permit records, Mount Pleasant SC. Official record.
- Charleston County Register of Deeds, 2026. Recorded deeds, Charleston County SC. Official record.
- Legacy Off-Market, 2026. Builder-demand sample for the 189-neighborhood study: 37 homes sampled in 29464, 18 acquired by builders, avg. older-home price 35.8% of new build. Proprietary sample; methodology in the limitations section above. Market data.
- National Association of Realtors, 2025. Typical seller commission structures, Charleston-North Charleston market. Industry report.
- Redfin, 2026. Recently sold homes and new construction, ZIP code 29464, Mount Pleasant SC. Market data (listings record).
- U.S. Census Bureau, 2025. QuickFacts: Charleston County, South Carolina. Government data.
- Zillow, 2026. Home values and recently sold, 29464. Market data (listings record).