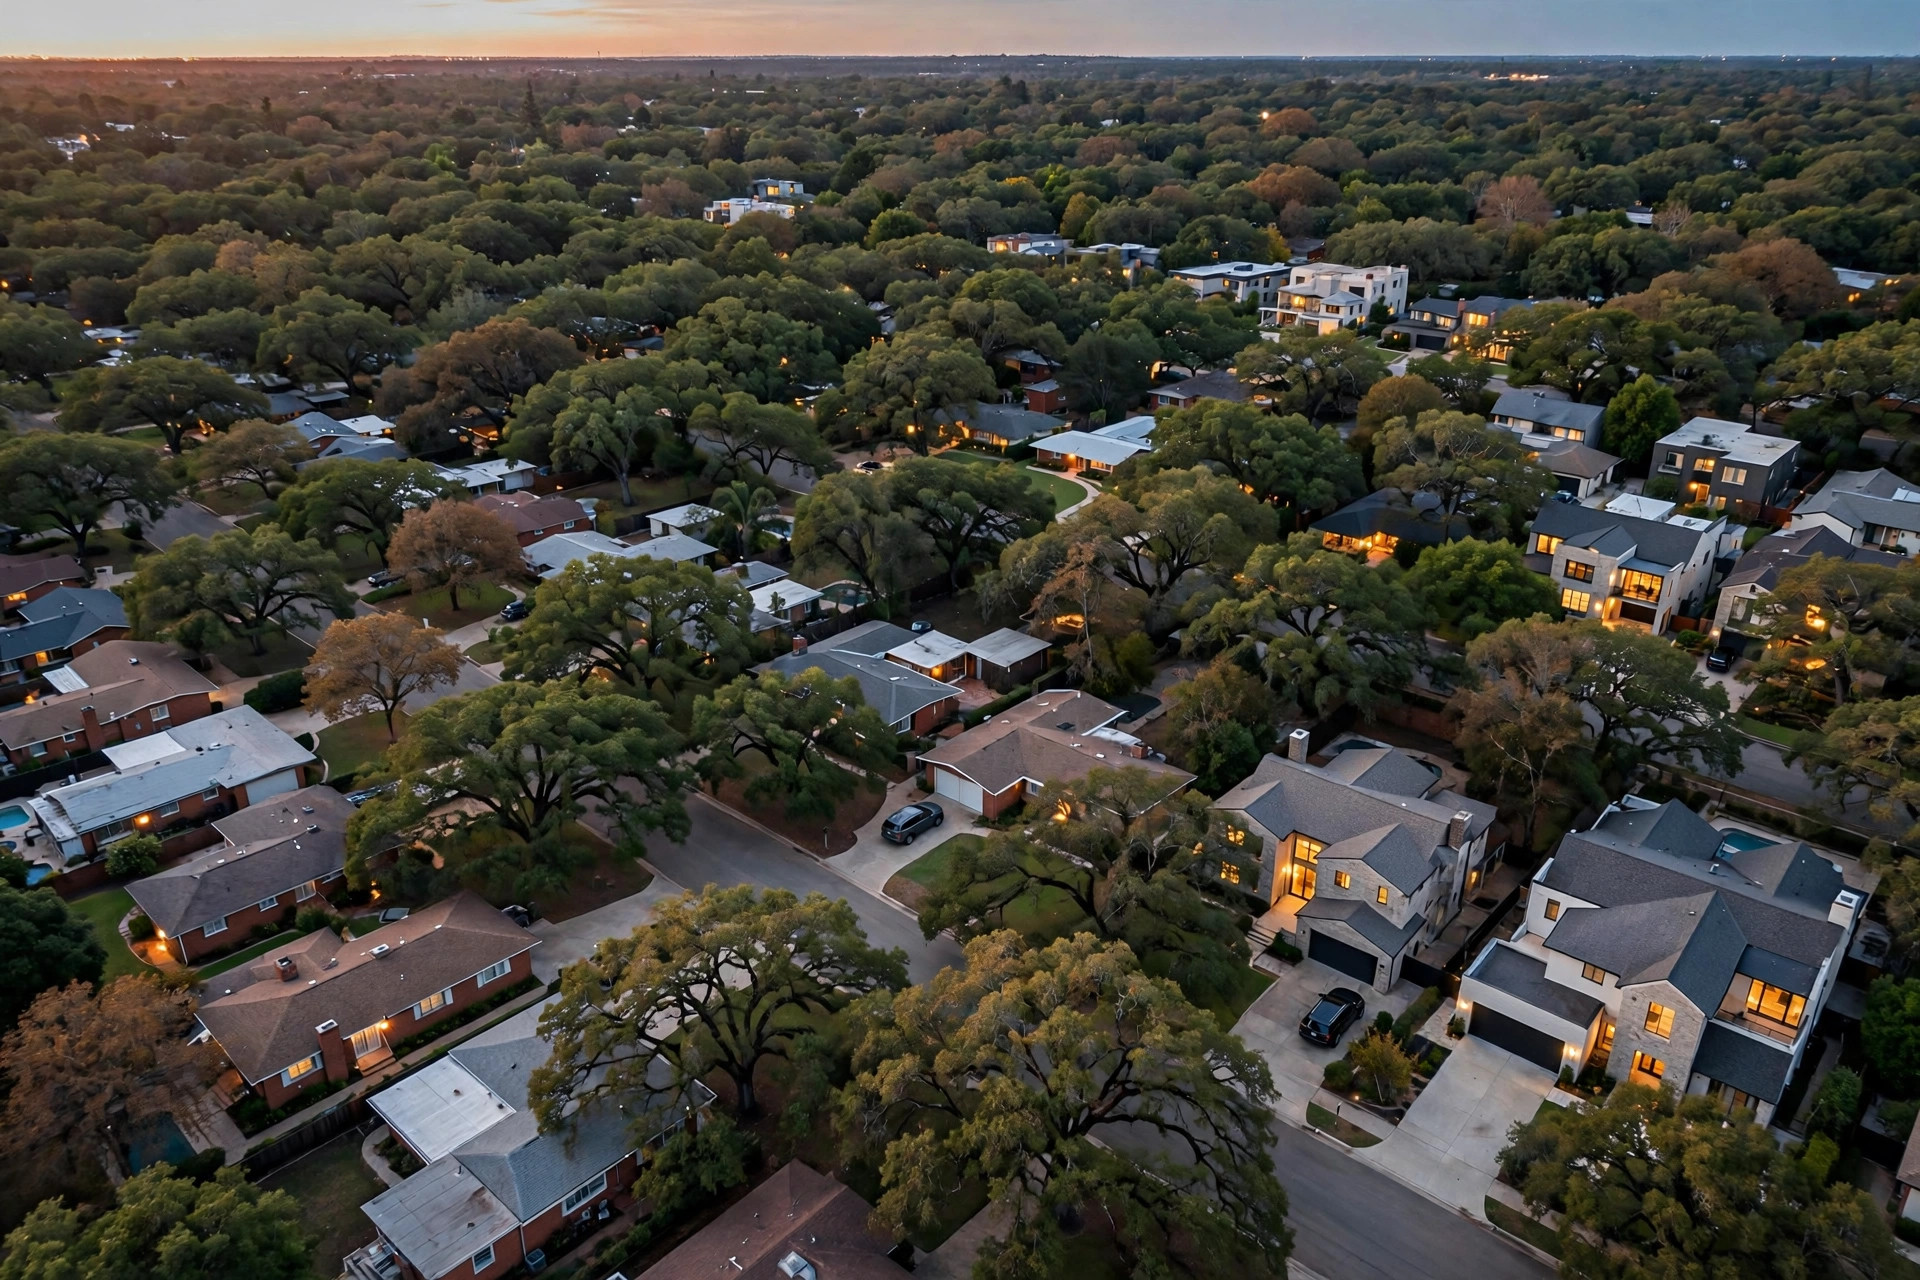
In the sample compiled for this report, 31 of 117 older homes in Brentwood's 37027 were acquired by builders and redeveloped with new construction, a builder-demand rate of 26.5%, ranking the ZIP ninth in the 189-neighborhood study (Legacy Off-Market, 2026). The older homes that changed hands sold for, on average, 39.6% of what new construction commands on a comparable lot in the same area. This headline deserves a careful read: the lowest builder-demand rate in the study, the largest sample, and the highest price ratio, and what that combination means for a Brentwood seller. The answer is not what the number looks like at first glance.
Key Findings
- 26.5% builder-demand rate, ranked #9, 31 of 117 sampled homes built in 1980 or earlier in 37027 were acquired by builders and redeveloped; the lowest rate in the study, but on the largest sample (117 homes).
- 39.6% price ratio, older homes sold for nearly two-fifths of new-build prices on comparable lots, the highest ratio in this batch, meaning the structure retains the most value here.
- 117-home sample, the deepest sample in the study, which makes the 26.5% figure the most statistically stable finding in the report series.
- Recent new builds sold from $2.3M to $7.0M, dated 2025-2026 Brentwood new-construction sales set the land-value ceiling (Nashville Home Guru, 2026).
- One decision matters most, reading the rate correctly: 26.5% of a deep sample is stronger evidence than 90% of a shallow one, and the Brentwood lot premium is real.
What does the builder-acquisition record in 37027 actually show?
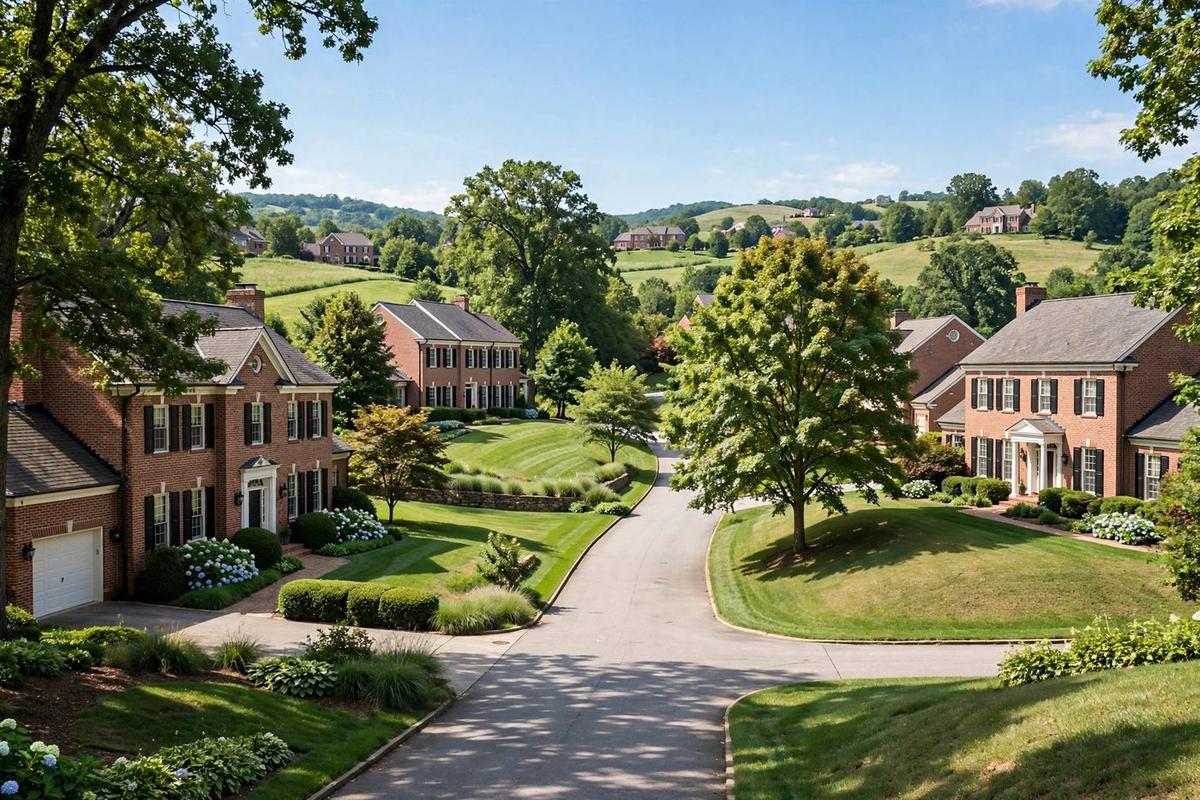
It shows the most honest number in the study, and the one most easily misread. Of 117 homes in the 37027 sample built in 1980 or earlier, 31 were acquired by builders, 26.5%, and the ZIP ranks ninth of 189 neighborhoods, just below Downtown Boca / Boca Raton Riviera, ranked eighth at 72.7%, on the study's composite ranking, which blends the raw builder-acquisition share with sample depth and the price-ratio signal. Brentwood is Williamson County's flagship suburb, large lots, top-ranked schools, and a housing stock that skews newer than most off-market builder markets, and the sample here is the largest in the study by a wide margin: 117 homes against 40 to 53 in the other ZIPs of this batch.
That depth changes what the number means. A 92.5% rate on 40 homes describes 37 builder acquisitions. A 26.5% rate on 117 homes describes 31 builder acquisitions, nearly as many builder acquisitions, measured with far less sampling noise. The composite ranking reflects this: 37027 ranks ninth not because its rate is low, but because 31 documented builder acquisitions in a deep sample, combined with the batch's strongest price-ratio signal, is robust evidence of an active off-market builder market. The replacement stock is large new suburban construction: dated 2025-2026 sales include $7.0 million in the Governors Club, $5.2 million on Franklin Road, and a band from $2.304 million to $3.35 million across Callie Lane, Honeyman, Champagne, Briarmont and Geralds (Nashville Home Guru, 2026). The 1970s and early-1980s brick traditionals they replaced trade at a fraction. The Tennessee comparison point is Belle Meade / West Meade, ranked fourth with an 85.4% builder-demand rate. Two cautions apply as everywhere: the sample over-represents pre-1981 housing by design, so the true ZIP-wide share is lower; and a builder-demand rate describes what buyers did after they bought, it does not set the seller's price, which requires the sold-price gap, covered next.
How wide is the gap between an older home and a new build?
The narrowest, in relative terms, in this batch, and still roughly two-and-a-half to one. In the 37027 sample, older homes sold for an average of 39.6% of the price of new construction on comparable lots. Put in concrete terms: where a new Brentwood home sells for $3,000,000, the older home on a comparable lot changed hands for roughly $1,188,000. The $1.8 million difference is the development premium, smaller, proportionally, than in the resort and estate markets, because Brentwood's older homes are newer, larger, and more livable than the cabins and ranch homes elsewhere in this study.
The dated sales record supports the scale. New construction sold in 2025-2026 from $2.304 million to $7.0 million (Nashville Home Guru, 2026). At 39.6%, an older home on a comparable lot changes hands at roughly $910,000 to $2.77 million, the land discounted for site preparation, carrying cost, and the builder's required margin. The ratio is the market's verdict: in Brentwood, the structure is worth something substantial, because a livable 1980 brick traditional in Williamson County has deep owner-occupant demand. It is still worth well under half of what the lot commands once rebuilt.
It means the seller's decision in Brentwood is genuinely close: the "live-in" buyer premium is the largest in this batch, and a well-kept older home can legitimately compete as a home. But it also means the land buyer is paying the largest absolute premiums in the batch for the right lot, a builder's residual on a $5 million new-build sale is a number no agent's comp sheet will show the seller. Just below Brentwood in the rankings, Paradise Valley Core, ranked tenth with a 60.8% builder-demand rate, shows the same land-dominant pricing.
What is the lot itself worth?
More than most Brentwood owners are told, and it can be estimated before any buyer calls. This is the question sellers ask most in every market in this study, and the method is public: any seller can run a simplified version.
Start with the new-build sale price on a comparable lot, the "as-new" value. In Brentwood, recent new construction has sold from roughly $2.3 million to $7.0 million depending on location, lot size and finish level (Nashville Home Guru, 2026). Subtract the cost to build that new home, construction cost, permits, financing, and the builder's required margin, and subtract site preparation. What remains is the residual land value: the most a rational builder can pay for the dirt and still make the project work.
Worked as an illustration, not a promise: a $3,500,000 new-build sale, minus roughly $1,400,000 in hard and soft construction costs, minus a builder margin near 20%, leaves a residual land value in the neighborhood of $1,350,000 to $1,500,000, before site-preparation costs of $40,000 to $80,000. That residual is the number a land buyer is actually negotiating against.
Three things move that number. Lot size is first: Brentwood's large-lot zoning is the foundation of the residual, at a 3,484 sq ft minimum in the sample (a small-footprint unit, flagged as such, not a buildable lot), the real builder-acquisition economics live on the half-acre-plus parcels. Second is the school zone and the street: in Williamson County, the address is a line item in the appraisal, and the new-build comps show it. Third is topography and usability, level, buildable acreage clears faster with builders than steep or constrained parcels. A seller who knows their residual land value negotiates from the builder's own math.
Should you fix it up or sell as-is?
In Brentwood, this question is genuinely close, which is exactly why it needs a disciplined answer. This is the most-asked question type in the seller research behind this series, "sell my house as-is or fix it up?", and in 37027 the data gives the most balanced answer in the study.
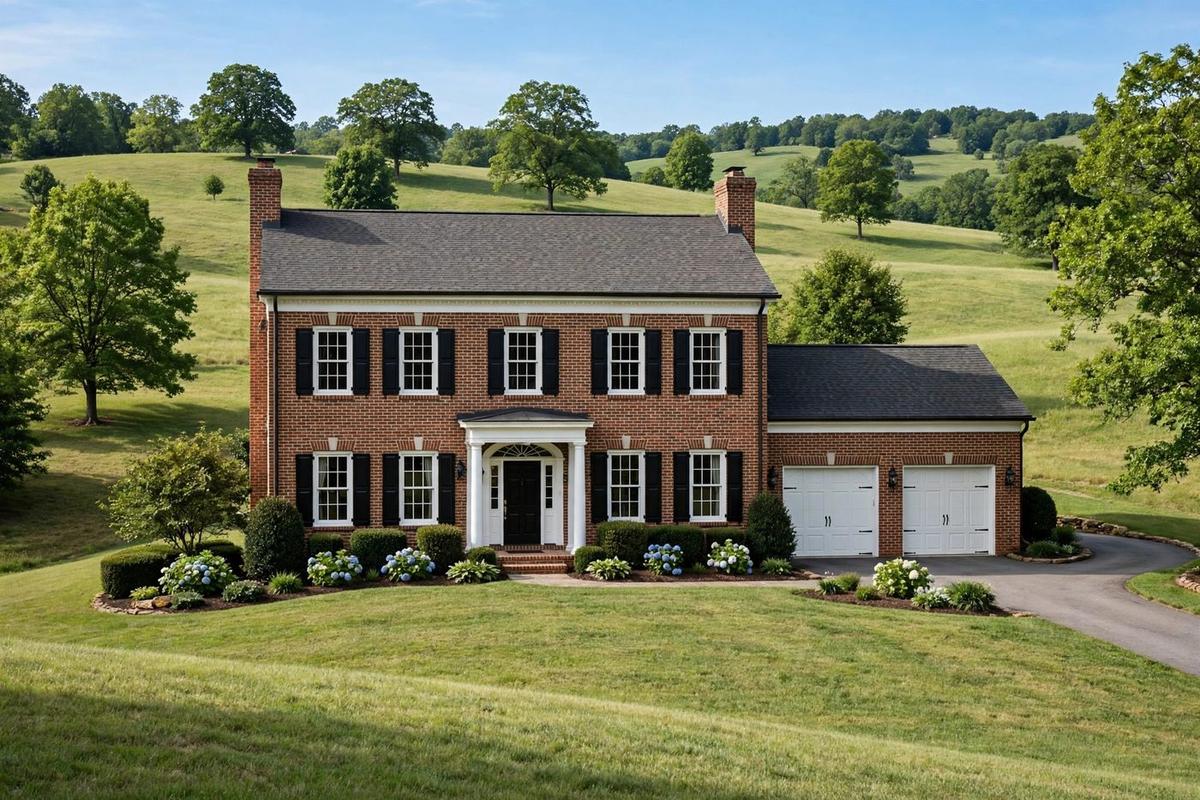
A $100,000 kitchen-and-bath update on a 1979 brick traditional might lift the sale price by $70,000 to $90,000 if the buyer intends to live in the home, a partial return, and better than in most off-market builder markets, because Brentwood's owner-occupant demand for older homes is deep. If the buyer intends to redevelop, the same $100,000 buys exactly $0: the finishes are stripped with the walls. With a 26.5% sample builder-demand rate and a 39.6% price ratio, the probability-weighted return on pre-sale renovation is better here than anywhere else in this batch, but it is still negative in expectation if the buyer is a builder.
The disciplined framework: if the home is genuinely livable, updated systems, no structural issues, the kind of brick traditional a family could move into tomorrow, listing it as a home can capture the largest "live-in" buyer premium in this study. If it is functionally obsolete, the systems are at end of life, the floor plan is dated beyond cosmetic repair, it is a candidate for a builder acquisition, and every dollar of renovation is a dollar the bulldozer collects. A seller should get a candid assessment of which of the two assets they own before spending a dollar on the structure. Spending on the wrong one is how sellers leave six figures on the table.
An off-market sale is as-is by definition, no repairs, no staging, no punch list. For a home that is a candidate for a builder acquisition, that is not a concession: the buyer never wanted the finishes anyway.
What does listing on the open market really cost?
More than the commission rate suggests, once time is priced in. Sellers routinely underestimate the all-in cost of a traditional listing, because the visible costs, the commission, are only part of it. The full ledger looks like this.
First, the commission: typically 5% to 6% of the sale price in the Brentwood market, split between listing and buyer's agents. On a $1,200,000 sale, that is $60,000 to $72,000 off the top (National Association of Realtors, 2025). Second, closing costs on the seller's side, title, transfer taxes, prorations, commonly another 1% to 2%. Third, concessions: in a market where buyers inspect 45-year-old homes, repair credits and price reductions after inspection routinely run $12,000 to $30,000 on older inventory.
Fourth, and most underweighted, is carrying cost over market time. A well-kept older home in Brentwood can move in 30 to 60 days, but a builder-acquisition candidate that misses the builder buyer and sits through a season costs the seller every month: mortgage or opportunity cost of equity, insurance, taxes, utilities, and maintenance on a large suburban home. At $1,200,000 with typical carrying costs, three to six months of market time costs $25,000 to $50,000 in pure hold expense. Fifth is the showing cost, which is not financial but real: months of keeping a home show-ready, vacating for showings, and living in limbo.
Add the midpoints and a $1,200,000 list price nets the seller something in the high $1,000,000s to low $1,100,000s after a normal market cycle, before any price reduction. This is the number an off-market offer should be compared against: not the list price, but the net proceeds after the full cost of achieving it.
How do you handle a cash buyer, and how do you tell one from a wholesaler?
Verify funds, verify closings, and never sign an assignable contract you don't understand. "How do I handle cash buyers?" is among the most common real questions sellers ask. The off-market space contains both legitimate direct buyers and intermediaries who never intend to buy your home at all.
The distinction matters. Legacy Off-Market is a wholesaler that sources off-market deals to builders: it buys the property directly from you off-market, with its own capital, closes in its own name, and then places it with a vetted builder. A wholesaler signs a purchase contract with no means or intent to close, then shops the contract to a real buyer for a fee, profiting from the spread between what they offered you and what the end buyer pays. In a market where large Brentwood lots carry seven-figure land values, the wholesaler's spread can be enormous, and every dollar of it comes out of the seller's equity. The Nashville-area builder market has an active assignment-contract ecosystem; sellers on large lots are prime targets.
Three verifications separate the two. First, proof of funds in the buyer's name, dated within the last 30 days, not a "pre-approval," not a letter from a "private lender." Second, a record of actually closed purchases: recorded deeds in the buyer's entity name, checkable in county records (Williamson County Register of Deeds, 2026). Third, the contract itself: a direct buyer closes in the name on the contract, with no assignment clause, and puts up a meaningful earnest-money deposit, typically 1% or more, that it forfeits if it walks away. An assignment clause plus a nominal deposit is the signature of a contract that was never meant to close.
The wholesaler's pitch is designed to feel like a buyer's, so ask the three questions.
Is it a bad time to sell an older home in Brentwood?
For most Brentwood sellers, this is the wrong question, the right one is which buyer you are selling to. "Is it a bad time to sell?" is a perennial question, and it makes sense for the ordinary resale market, where interest rates and inventory swings move prices quarter to quarter. If the home is genuinely livable, the 39.6% ratio says the structure retains the most value in this batch, the resale market is the channel: list in the strong spring season, price to the owner-occupant comps, and capture the "live-in" premium. If the home is a candidate for a builder acquisition, functionally obsolete on a large, desirable lot, the off-market builder market is the channel, and timing follows the builder's cycle: residual land value, construction costs, and the availability of competing lots, not mortgage rates. A builder's land bid does not depend on whether rates are 6% or 7.5%.
The mistake is selling to the wrong pool at the wrong time: listing a candidate for a builder acquisition in the resale market and watching it sit, or selling a livable home off-market at land value and leaving the "live-in" premium behind. The question to ask is not whether this is a good time in the abstract. It is which of the two assets you own, a house someone will live in, or a lot someone will build on, and which channel pays more for it.
What does off-market change about the sale itself?
Nearly everything except the price, which it often improves.
Privacy: zero showings, zero open houses, no public marketing period. In Brentwood, a listed sale is visible to the whole school zone; an off-market sale is private until the deed records.
Timing: close in 7 to 21 days, against 60 to 120-plus days for a listed older home, or take longer with a leaseback.
Commissions: none of the typical 5% to 6% (National Association of Realtors, 2025).
Closing costs: none of the typical 1% to 2% seller-side costs. Together they commonly exceed $72,000 on a $1,200,000 transaction.
Inspections: no inspection contingency, so no $10,000 to $30,000 repair credits or price reductions. As-is means the offer is the final number.
Methodology and limitations
The record here has three parts: Legacy Off-Market's builder-acquisition sample for the 189-neighborhood study (117 homes in 37027 built in 1980 or earlier, 31 acquired by builders, older homes averaging 39.6% of new-build prices on comparable lots), Williamson County parcel and permit records confirming builder-acquisition activity directionally, and dated sold listings for the ZIP behind the new-build price ranges. The series' 348-question seller research chose the questions answered here.
Not verified: no title search, no condition inspection, no sale confirmed beyond its listing record. Price ranges are illustrations, not appraisals; the residual-land math is a simplified model.
The central limitation is selection, and it cuts both ways. The 117-home sample is the deepest in the study, which shrinks sampling noise, but it was still built to find pre-1981 housing. The 26.5% describes the sample: robust evidence of an active off-market builder market, not a census of Brentwood.
Conclusion
So what does a 26.5 percent builder-demand rate mean in Brentwood? It means the off-market builder market here is real, documented across the deepest sample in the study, and operating on the largest lots with the highest structure values in the batch. The 26.5% is not a sign of weakness: it is a sign of a market where older homes are good enough to live in and lots are valuable enough to rebuild on, and 31 documented builder acquisitions is the evidence the land buyer is active.
Legacy Off-Market buys as a principal in Brentwood and the other 188 neighborhoods in this study, with proof of funds and a record of completed purchases behind every offer, and places each property with a vetted builder. Sellers can reach the acquisitions team at 401-219-4207 or aidansowa@outlook.com.
When the deepest sample in the study finds the land buyer active on your street, is the question the rate, or the residual?
Frequently Asked Questions
How do I know if Legacy Off-Market buys in my ZIP code?
Legacy Off-Market buys in 189 neighborhoods across 26 states, and the Brentwood local submarket (37027) is ranked ninth in the study. Enter your ZIP in the coverage checker to confirm, or call 401-219-4207.
Will I get less selling off-market than listing with an agent?
Compare net proceeds. A $1,200,000 Brentwood listing typically nets in the high $900,000s after commission, closing costs, inspection credits, and carrying costs over market time. An off-market offer deducts none of that. Get the off-market number first.
Do I need to make repairs before selling off-market?
No. The sale is as-is, and where the land buyer pays the largest absolute lot premiums in this batch, renovation spending rarely changes the land bid. The builder's residual is the number that matters.
How fast can an off-market sale close?
A direct cash buyer can close in 7 to 21 days, against 60 to 120-plus days for a listed older home. The seller chooses the date, and a leaseback bridges a slower move.
How is an off-market buyer different from a wholesaler?
A direct buyer closes in its own name with its own funds and risks a real deposit; a wholesaler assigns your contract for a fee. Ask for proof of funds dated within 30 days, recorded prior closings in the buyer's name, and a non-assignable contract.
What does Legacy Off-Market need from me to make an offer?
The property address, your timeline, and permission to pull public records. No showings, no staging, no open houses. Call 401-219-4207 or email aidansowa@outlook.com.
Sources
- Legacy Off-Market, 2026. 189-neighborhood builder-acquisition study: 117 homes sampled in 37027, 31 acquired by builders, 26.5% builder-demand rate; older homes averaged 39.6% of new-build prices. Proprietary sample; methodology in the limitations section. Market data.
- Nashville Home Guru, 2026. Dated new-construction sales, Brentwood / 37027. Market data.
- National Association of Realtors, 2025. Profile of Home Buyers and Sellers. Industry report.
- Redfin, 2026. Recently sold homes and new construction, ZIP code 37027, Brentwood TN. Market data.
- U.S. Census Bureau, 2025. QuickFacts: Brentwood, Tennessee. Government data.
- Williamson County, 2026. Property records and permits, Brentwood TN. Official record.
- Zillow, 2026. Home values and recently sold, 37027. Market data.